Tracing
Learn about using tracing and distributed tracing for observing and debugging application performance issues. You'll see the impact of errors across your full stack and microservices.
Tracing is the process of capturing the timing and flow of requests and operations as they happen throughout your application. It can be a powerful debugging tool, helping you identify which link in a sequence of events is causing a problem.
Distributed tracing provides a unified view of how a single request moves from the frontend to the backend and beyond. This is particularly useful in modern applications, which are often composed of multiple services working together. To get a distributed view of your application, instrument Sentry in both your frontend and your backend.
With distributed tracing, you can identify performance bottlenecks that are affecting your application no matter where in your application's workflowthey occur. You can then use Sentry tools such as the Trace Explorer or Trace View page to dig deeper and find the root cause of the problem. Distributed tracing is particularly helpful for identifying problems you can't just debug using console logs, such as race conditions, N+1, and caching issues.
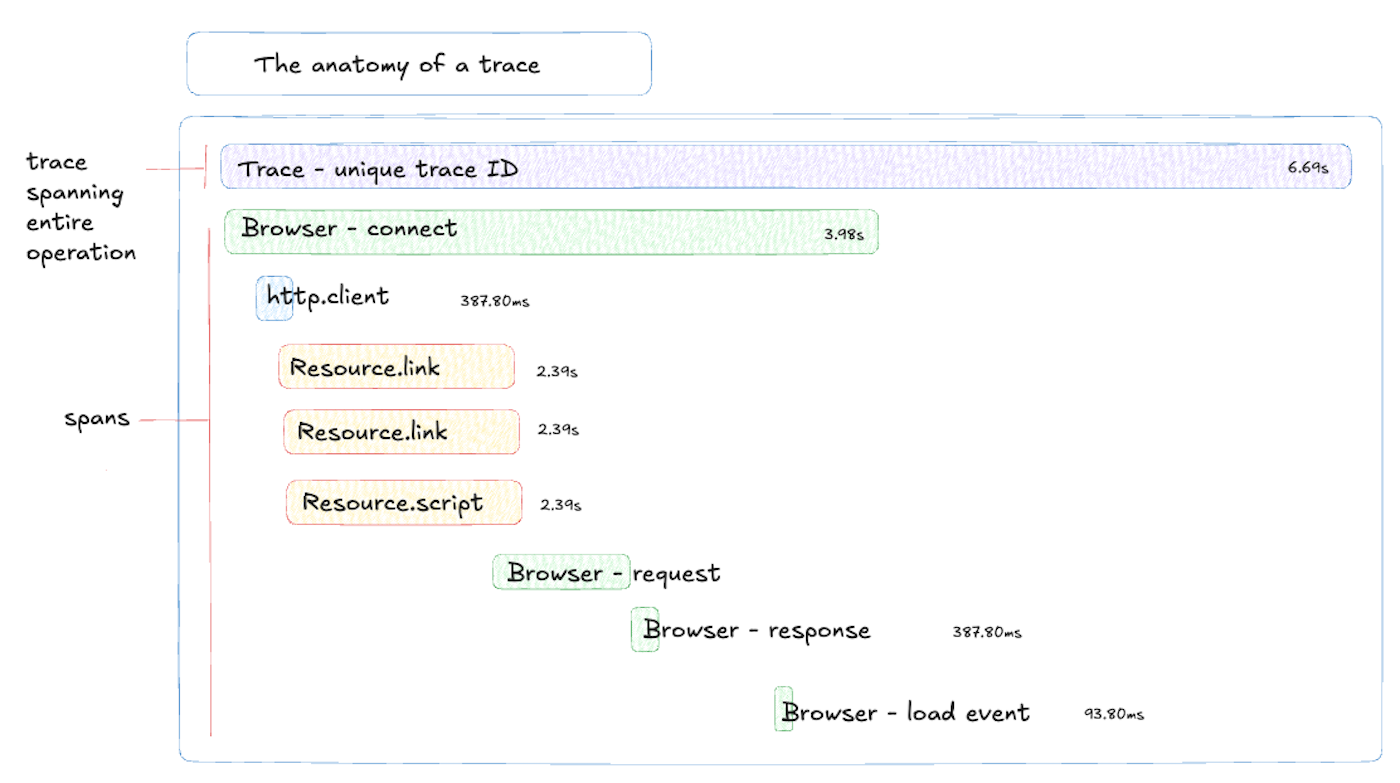
Each trace has a string of globally unique characters called a trace ID, that's shared by both frontend and backend services they help connect all the actions that take place to make an event such as a button click or a page scroll. Each trace is composed of multiple spans.
A span is a named, timed operation that represents a part of the application workflow. It provides granular insights into specific tasks, like API requests or database queries. Multiple spans are pieced together to create a trace. providing a comprehensive view of its path, timing, and interactions for troubleshooting and performance analysis.
Transactions are a Sentry-specific unit of measurement that references any event that users send to Sentry. In addition to standard event fields, transactions also contains child spans and have a unique transaction ID.
To get the most out of tracing in Sentry, you'll need to instrument both the frontend and backend of your application with Sentry's SDK. Once this is done, there are several places where you can view and interact with tracing data:
Explore to Traces to Trace View
You can view all the traces in your organization by going to the Traces page in Sentry. You'll see a chart and a list of traces and be able to see at-a-glance how long each trace took to complete and the number of spans it contains.
If you want more information, click on any trace ID. This will take you to the Trace View page, which provides a more detailed view of the trace and its spans. Here, you'll see a waterfall view of the spans in the trace, which will show you how long each service and process took to complete and may give you an indicator of where a problem may be coming from. Learn more about the Sentry Trace View.
Alternatively, you can use the search bar to look for traces by name, project, or other criteria. You can also use the tags section to filter traces by specific tags. Learn more about the Sentry Trace Explorer.
Performance to Trace View
If you're interested in a high-level view of your application's performance, you can start from the Performance page in Sentry where you'll see a list of transactions. Clicking on the transaction ID will take you to the Trace View page for that transaction. Learn more about using Sentry's Performance Monitoring.
Our documentation is open source and available on GitHub. Your contributions are welcome, whether fixing a typo (drat!) or suggesting an update ("yeah, this would be better").